
INitial FIndings
A brief summary
Overview
Hello there! This page will give you an overview/summary of a few key data points that we’ve uncovered after one week with a brand new website and your first FB ad. As a reference, “reach” refers to the number of people who saw your ads at least once. The goal of our first social campaign was to determine Sweet Bath’s audience and we will continue to refine things like ad placement and re-targeting as we move forward. Keep in mind that we still have very little data to work from and that our insights will get more and more detailed over time.
Total Ad Spend
$218.27
Duration
5 Days
Total Reach
6,681
Initial Demographic Information
A couple of points to consider about these demographic findings:
1) Online shoppers are buying as much (or more) for other people as they are for themselves during the holiday shopping season. This is a likely reason for the gender and age data you see here which wasn’t necessarily what we were expecting but still very useful.
2) Ads are SUPER competitive this time of year. Everyone that sells a product doubles down on their ad spend during the holidays which means there is a lot more noise for your potential customers to sift through as they shop related product categories.
It’s a great sign that we were able to extrapolate this much information without spending the entire week’s ad budget. The upper funnel traffic driven to the site is another great sign as it essentially means there were hundreds of new people who have now been exposed to Sweet Bath’s products and brand.
Gender Breakdown
%
Men
%
Women
Age Breakdown
%
65+
%
35-44
%
55-64
%
55-64
Website TRAFFIC
We compiled the data you see below using tools designed to drill down into where your traffic is coming from. The better we understand the traffic, the more effectively we can create content to target customers who are the most likely to buy. This data can also help influence product development as we see trends emerge further down the road.
174
unique Visits
546
total Pageviews
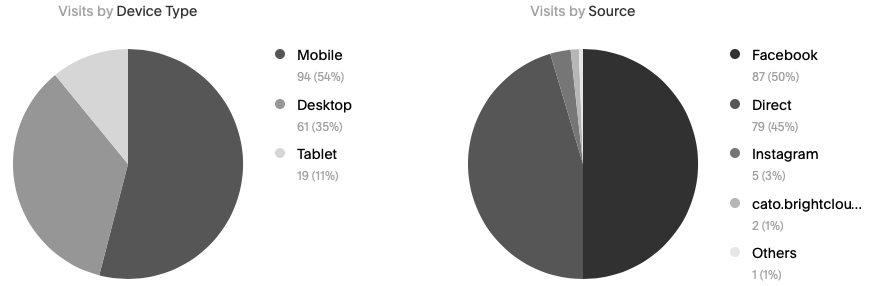
Sources
The pie graphs below depict the sources of traffic to Sweet Bath’s website. This information will be critical moving forward and help us determine where people are coming from and how best to reach them with ads and other content.
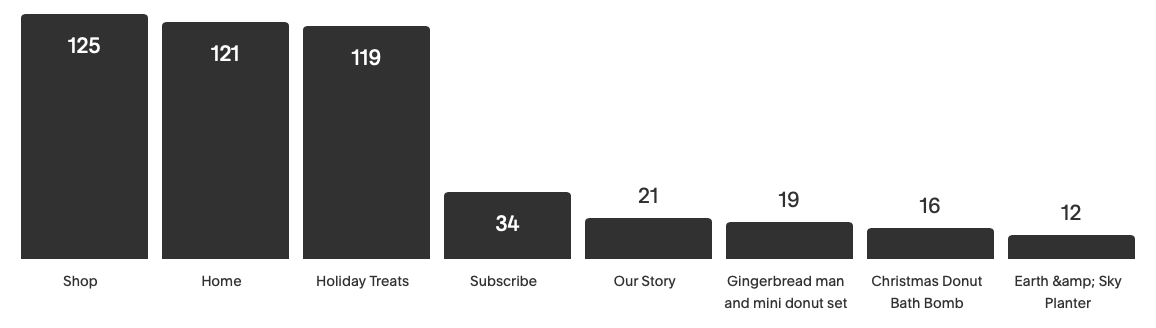
Popular Content
This graph shows where visitors are spending their time while on the site. This will obviously become important data to analyze in order to determine which products are selling and what type of content is resonating with potential customers.
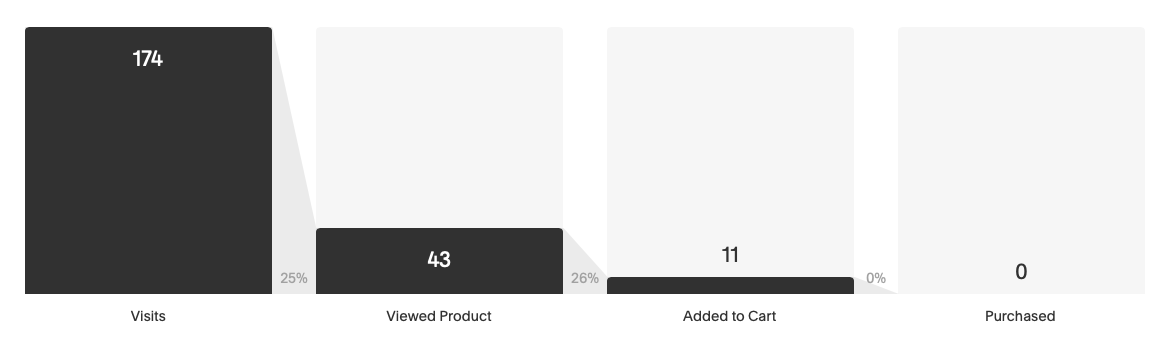
Purchase Funnel
Starting from the top, a purchase funnel typically consists of six stages. Those stages are awareness, interest, consideration, intent, evaluation, and purchase. The goal is to load-up the top of the funnel with new potential customers through ads and other content and then continue to provide them with relevant information all the way down the funnel until a purchase is made. The breakdown below shows the top of funnel data, “visits”, down to the bottom of funnel data, “purchases”. Purchases are obviously the coveted prize of every online brand. While nobody has completed a checkout yet, the fact that 6% of the individuals who “visited” the site also put something in their cart, is a great sign.
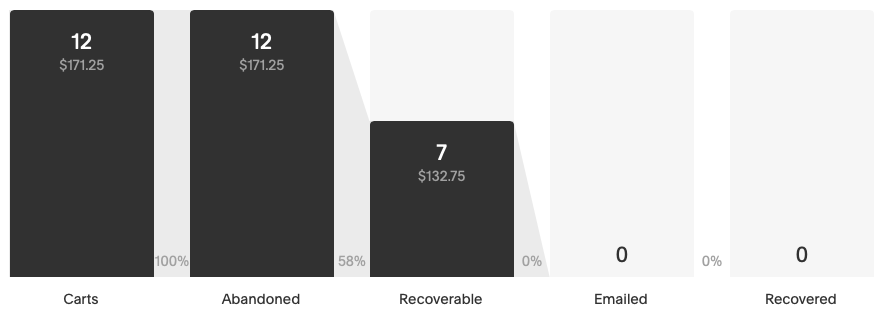
Abandoned Cart
An abandoned cart is an e-commerce term used to describe a visitor on a web page who leaves the checkout page before completing their purchase. Luckily, we can automatically send reminders to customers who abandon their carts.. These emails are automatically sent 24 hours after a cart or checkout is abandoned so you can stay in touch while your store is still fresh in shoppers’ minds. The industry average for an abandoned cart is 70%. Right now, Sweet Bath has a 60% abandon rate which is again, another good sign.
We have a lot of great data to work with already and we will go over next steps with you on the phone.
Thanks!